
Export to PostHog
PostHog is a product analytics platform that helps you understand user behavior and debug issues. By exporting your Cloudflare Workers application telemetry to PostHog, you can:
- Correlate logs with user sessions, events, and error tracking data
- Query and filter logs by severity, attributes, and custom properties
- Connect application logs to session replays for full debugging context
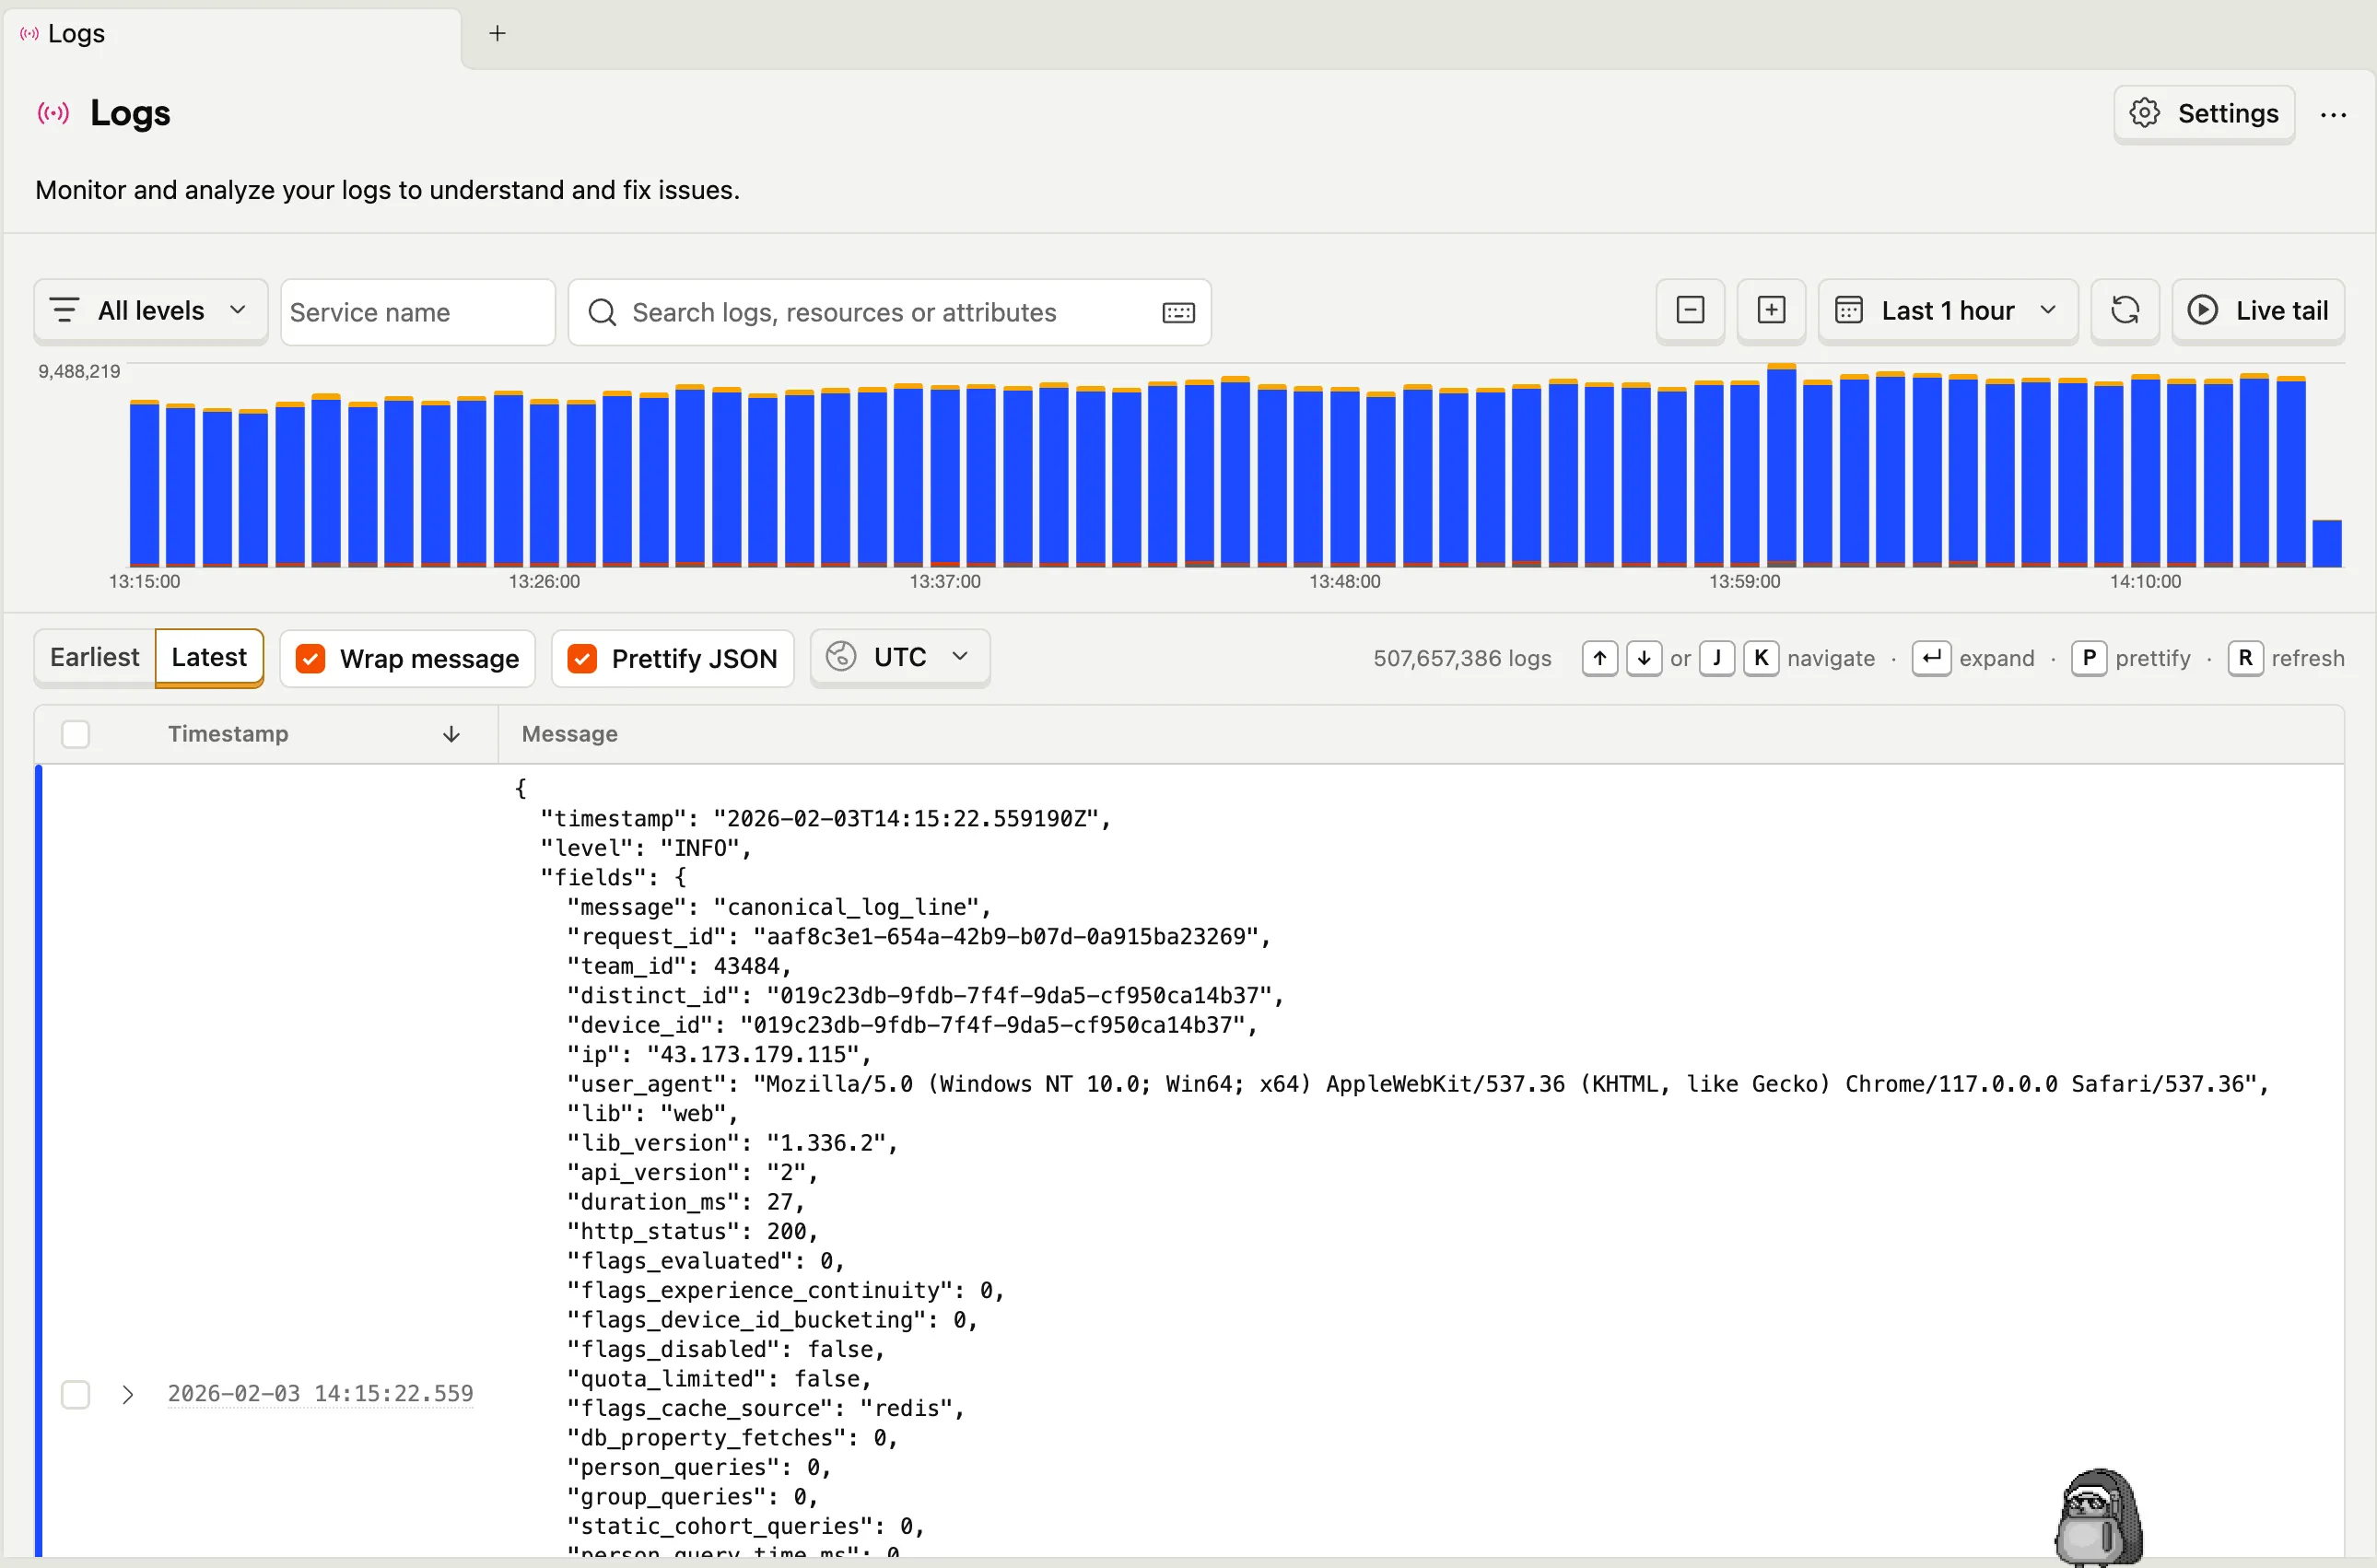
This guide will walk you through configuring your Cloudflare Worker application to export OpenTelemetry-compliant logs to PostHog.
Before you begin, ensure you have:
- An active PostHog account ↗ (free tier available)
- A deployed Worker that you want to monitor
- Your PostHog project API key
- Log in to your PostHog account ↗
- Navigate to the Project settings ↗
- Find your Project API key in the project details section
- Copy the API key - this is the same key used for capturing events and exceptions
The API key should look something like: phc_xxxxxxxxxxxxxxxxxxxxxxxxxxxxxxxxxxxxxxxx
PostHog has different endpoints depending on your data region:
| Region | Logs Endpoint |
|---|---|
| US (default) | https://us.i.posthog.com/i/v1/logs |
| EU | https://eu.i.posthog.com/i/v1/logs |
You can find your region in your PostHog project settings or by checking the URL when logged into PostHog (either us.posthog.com or eu.posthog.com).
Now you'll create a destination in the Cloudflare dashboard that points to PostHog.
- Navigate to your Cloudflare account's Workers Observability ↗ section
- Click Add destination
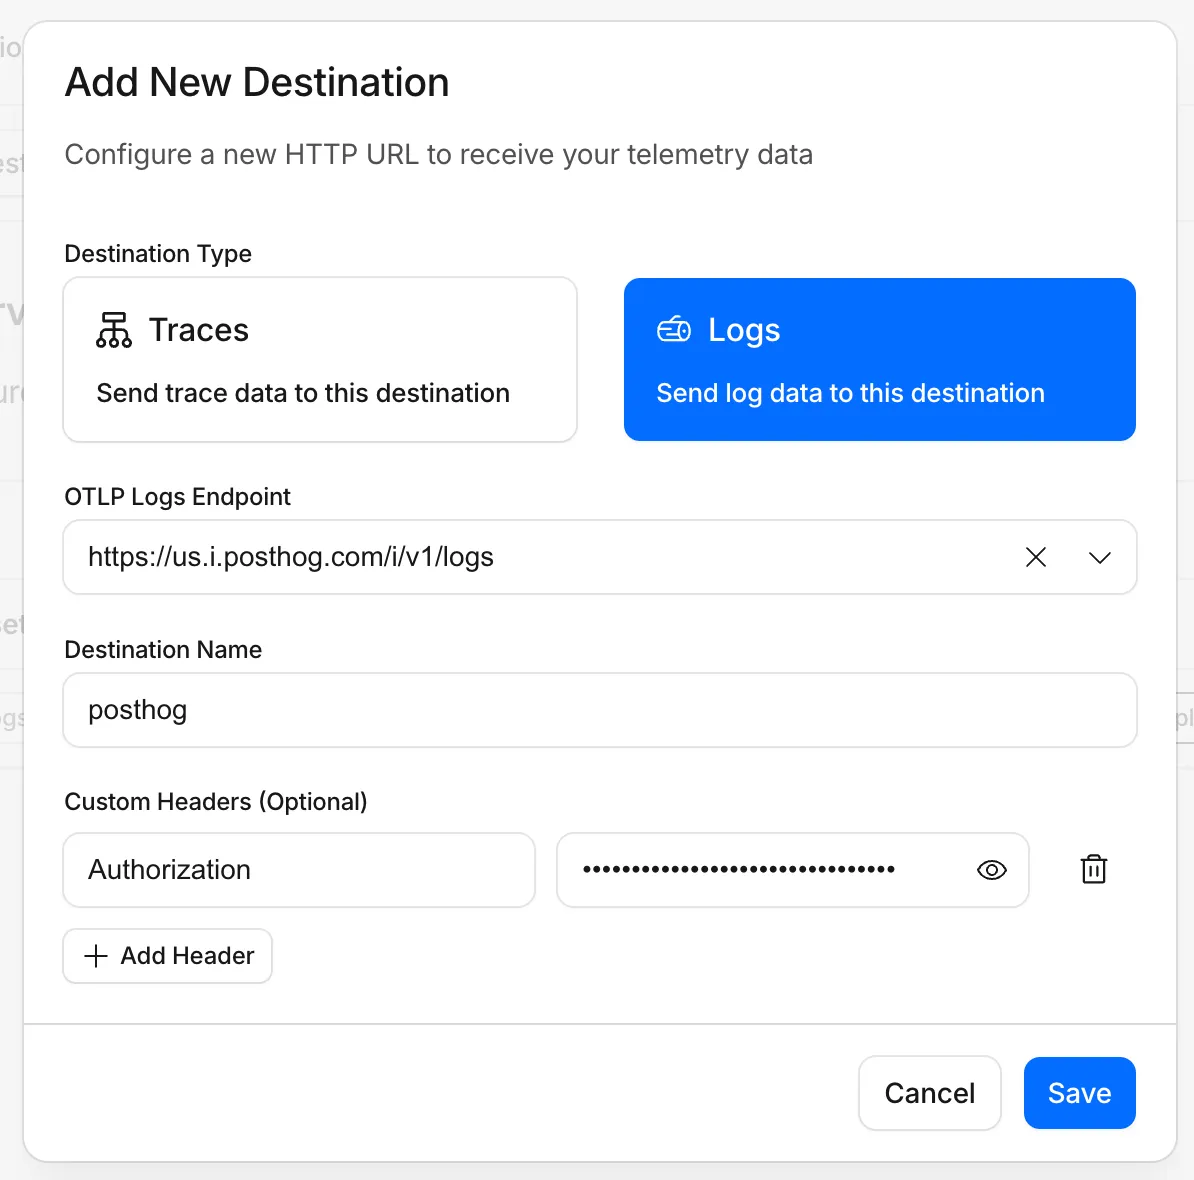
- Configure your logs destination:
- Destination Name:
posthog-logs(or any descriptive name) - Destination Type: Select Logs
- OTLP Endpoint: Your PostHog logs endpoint (e.g.,
https://us.i.posthog.com/i/v1/logsorhttps://eu.i.posthog.com/i/v1/logs) - Custom Headers: Add the authentication header:
- Header name:
Authorization - Header value:
Bearer <your-project-api-key>(e.g.,Bearer phc_xxxxx...)
- Header name:
- Destination Name:
- Click Save
With your destination created in the Cloudflare dashboard, update your Worker's configuration to enable logs export.
{ "observability": { "logs": { "enabled": true, // Must match the destination name in the dashboard "destinations": ["posthog-logs"] } }}[observability.logs]enabled = truedestinations = [ "posthog-logs" ]After updating your configuration, deploy your Worker for the changes to take effect.
Once your Worker is deployed and receiving traffic:
- Log in to your PostHog account ↗
- Navigate to the Logs section in the left sidebar
- Your Worker logs will appear with severity levels, timestamps, and attributes
You can filter logs by:
- Severity level (trace, debug, info, warn, error, fatal)
- Time range
- Custom attributes added to your log entries
- Keywords in log messages
You can add custom attributes to your logs using standard console methods with structured data:
export default {  async fetch(request, env) {    // Basic logging    console.log("Processing request");
    // Logs with additional context    console.info("User action", {      userId: "user_123",      action: "api_call",      path: new URL(request.url).pathname    });
    // Error logging with details    console.error("Request failed", {      error: "Connection timeout",      retryCount: 3    });
return new Response("OK"); }};These attributes will be searchable and filterable in the PostHog logs interface.
- Verify your API key: Ensure you're using your project API key (starts with
phc_), not a personal API key - Check the endpoint region: Confirm you're using the correct regional endpoint (US or EU) matching your PostHog instance
- Confirm destination status: In the Cloudflare dashboard, verify your destination shows a recent successful delivery
- Check sampling rate: If you've configured a sampling rate, not all logs may be sent
If you see authentication errors in your destination status:
- Ensure the Authorization header value includes
Bearerprefix followed by your API key - Verify the API key has not been revoked or regenerated in PostHog
- Alternatively, you can pass the token as a query parameter by using
https://us.i.posthog.com/i/v1/logs?token=<your-project-api-key>as your endpoint